Debugging MPI applications using Totalview
- Details
- Hits: 7587
Running this debugger requires remote X acces. For this, familiarize yourself to this article. (Remote display on Cluster nodes).
Another article would be running MPI applications on the NCIT cluster and Debugging simple applications using Totalview.
Quicksteps:
Debugging MPI applications with totalview is simmilar to running simple debug with Totalview. You must only add -tv to mpirun, or you cand run totalview directly and select a Parallel job execution. (see user manual).
[alexandru.herisanu@fep-53-3 mpi]$ cat debug.sh
#!/bin/bash
module load compilers/gcc-4.1.2
module load mpi/openmpi-1.3.2_gcc-4.1.2
module load debuggers/totalview-8.4.1-7
setenv DISPLAY fep-53-3.grid.pub.ro:1000.0
# You can ask mpirun to start TotalView
#mpirun -np $NSLOTS -tv ./mpi_scatter
# or you can run it yourself, but now you have $NSLOTS available.
#You can use your own public/private key authentication or
#Sun Grid Engine's rsh
totalview
-----
[alexandru.herisanu@fep-53-3 mpi]$ qsub -q ibm-quad.q -pe openmpi 4 -cwd debug.sh
Your job 16 ("debug.sh") has been submitted
Debugging using Totalview
- Details
- Hits: 11096
Running this profiler requires remote X acces. For this, familiarize yourself to this article. (Remote display on Cluster nodes).
Quicksteps:
- compile your program using debug symbols
- connect to fep using NX client and allow remote usage
- setup necesarry env. variables (DISPLAY, FLEXLM etc.)
- run totalview
[TBA]
Without modulefiles
Get your display screen by connecting via NX Client, allow remote display connections:
[alexandru.herisanu@fep-53-3 ~]$ echo $DISPLAY
:1000.0
[alexandru.herisanu@fep-53-3 ~]$ xhost +
access control disabled, clients can connect from any host
[alexandru.herisanu@fep-53-3 ~]$
Now, your display variable will be fep-53-3.grid.pub.ro:1000.0
Run the following script (using bash or csh, this script is in bash. In this case we wanted to run this only on quad-wn16)
[alexandru.herisanu@fep-53-3 app_profiling]$ qsub -q
This email address is being protected from spambots. You need JavaScript enabled to view it.
-cwd
module load debuggers/totalview-8.4.1-7
setenv DISPLAY fep-53-3.grid.pub.ro:1000.0
totalview
Your job 10 ("STDIN") has been submitted
!! Using -S /bin/bash does not seem to work here. it will not find module program !!
Done.
Line 1: setup the environment for totalview. Modulefile is: debuggers/totalview-8.4.1-7
Line 2: set remote display location
Line 3: run totalview
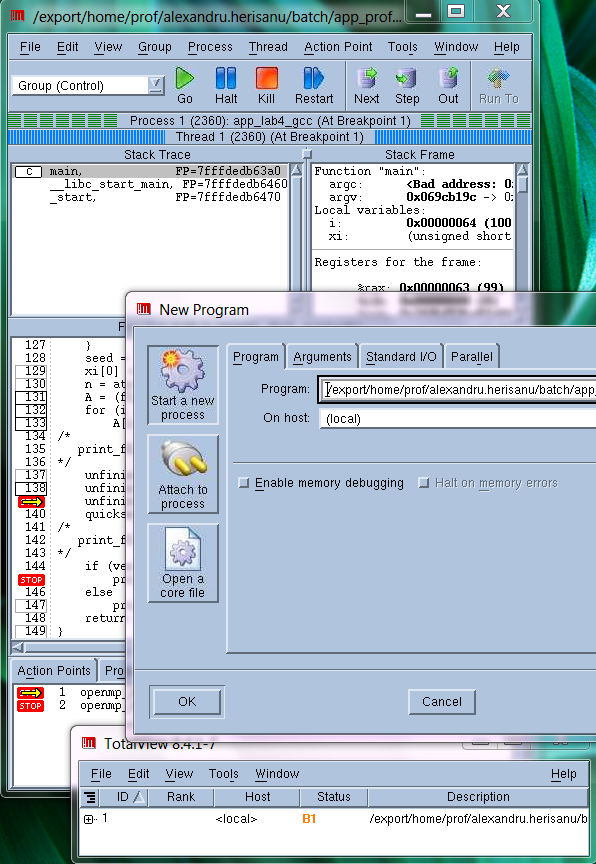
Select your program and it will work like a regular debugger.
Intel MPI Trace Analyser and Colector
- Details
- Hits: 6368
Intel MPI Trace Analyser and Collector pe clusterul NCIT
How to run:
Environmentul paralel de folosit este intelmpi sau intelmpi*1. Pentru a rula analizer-ul trebuie sa te conectezi cu -X sau prin NX.
#!/bin/csh
source /opt/intel/Compiler/11.1/038/bin/iccvars.csh intel64
source /opt/intel/impi/3.2.1/bin64/mpivars.csh
source /opt/intel/itac/7.2.1.008/bin/itacvars.csh
setenv MPD_CON_EXT "sge_$JOB_ID.$SGE_TASK_ID"
mpiexec -trace -np $NSLOTS ./hello_world.exe
Pentru a rula pe cluster:
[heri@fep-53-2 intel_lab]$ qsub -cwd -q ibm-quad.q -pe intelmpi*1 2 intelmpi_trace.sh
La sfarsit, vei avea un output *.stf.
Running Intel VTune analyser on the NCIT Cluster
- Details
- Hits: 7600
Running this profiler requires remote X acces. For this, familiarize yourself to this article. (Remote display on Cluster nodes).
!! VTune must run on a local hard disk. It can not run on the shared lustre file system. !!
!!You must be in group vtune to be allowed to run. Contact prof. Emil Slusanschi or myself for getting into the vtune group !!
Quicksteps:
- connect to fep using NX client and allow remote usage
- setup necesarry env. variables (DISPLAY, VTUNE_USER_DIR, vtunevars.sh)
- run vtlec
[TBA]
Without modulefiles
Get your display screen by connecting via NX Client, allow remote display connections:
[alexandru.herisanu@fep-53-3 ~]$ echo $DISPLAY
:1000.0
[alexandru.herisanu@fep-53-3 ~]$ xhost +
access control disabled, clients can connect from any host
[alexandru.herisanu@fep-53-3 ~]$
Now, your display variable will be fep-53-3.grid.pub.ro:1000.0
Run the following script (using bash or csh, this script is in bash. In this case we wanted to run this only on quad-wn16)
[alexandru.herisanu@fep-53-3 ~]$ qsub -q This email address is being protected from spambots. You need JavaScript enabled to view it. -cwd -S /bin/bash
export DISPLAY=fep-53-3.grid.pub.ro:1000.0
export VTUNE_USER_DIR=/scratch/tmp
. /opt/intel/vtune/bin/vtunevars.sh
vtlec
Your job 5 ("STDIN") has been submitted
Done.
Line 1: setup your remote display
Line 2: Use a local directory as scratch (you will also need to do the same with your workspace)
Line 3: Import necesarry vtune vars
Line 4: run VTune Eclipse.
Profiling with Sun Studio Analyzer
- Details
- Hits: 12470
This tutorial is based on fep.grid.pub.ro, the NCIT-Cluster Front End Processor. Everything you want to know about Sun Studio Analyzer is here.
Nobody says it better then Sun: watch this video tutorial about Sun Studio Analyzer and check the links section.
First, you need X Windows System forwarding. If you use Windows click here. and install Xming X Server for Windows.
Linux:
ssh This email address is being protected from spambots. You need JavaScript enabled to view it. -X
I. Start Sun Studio Analyzer:
[andrei.dumitru@fep ~]$ analyzer
II. Collect Experiment data
1. Go to File -> Collect Experiment...

2. Select the Target , Working Directory and add Arguments if you need to.
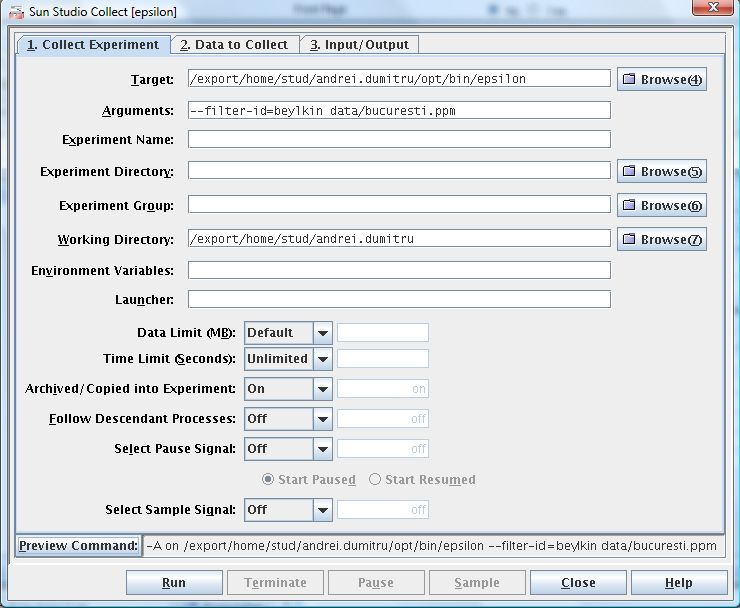
3. Click on Preview Command to view the command for collecting experiment data only.
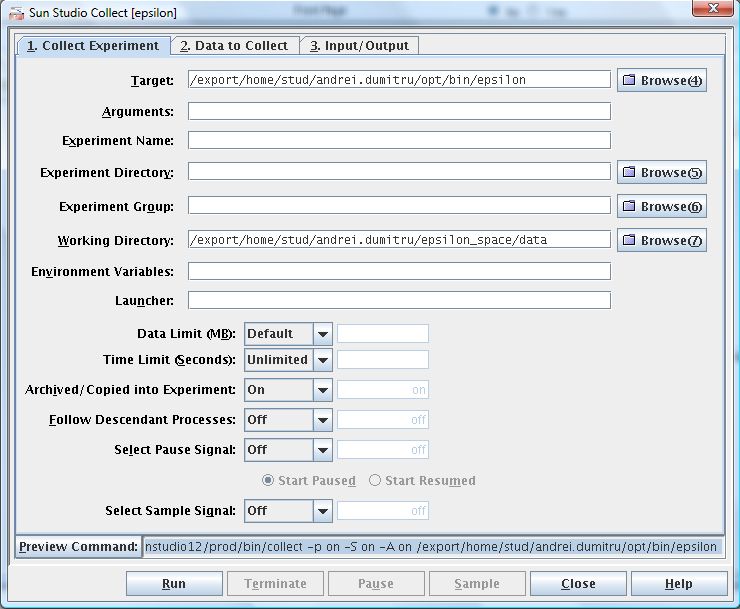
4. Run your job on the cluster and wait for the results
[andrei.dumitru@fep ~]$ qsub -q ibm-quad -pe ibm-quad 2 -cwd -b y  \
   "/opt/openmpi/gnu-gcc/bin/mpirun -np 8 /opt/sun/sunstudio12/prod/bin/collect \
   -p on -m on -S on -A on /export/home/stud/andrei.dumitru/opt/bin/epsilon \
   --filter-id=beylkin data/bucuresti.ppm"
Highlighted with red is the collect command. In blue you can see the mpirun command and with pink the command to submit jobs
to the ibm-quad queue.
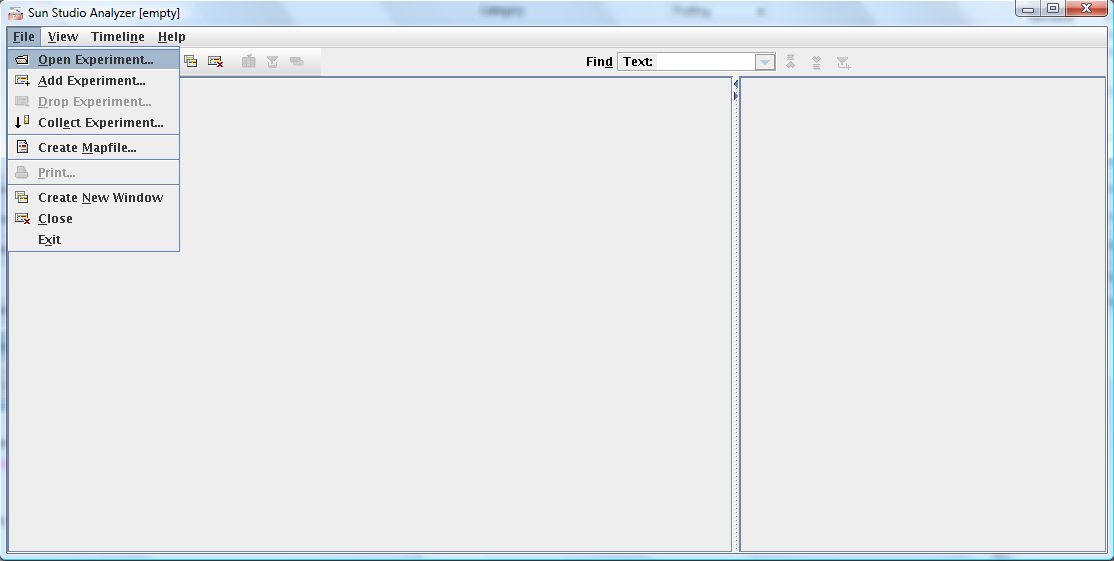
5. Open the results
Go to File -> Open Experiment...
7. Select all the experiments you want to open.
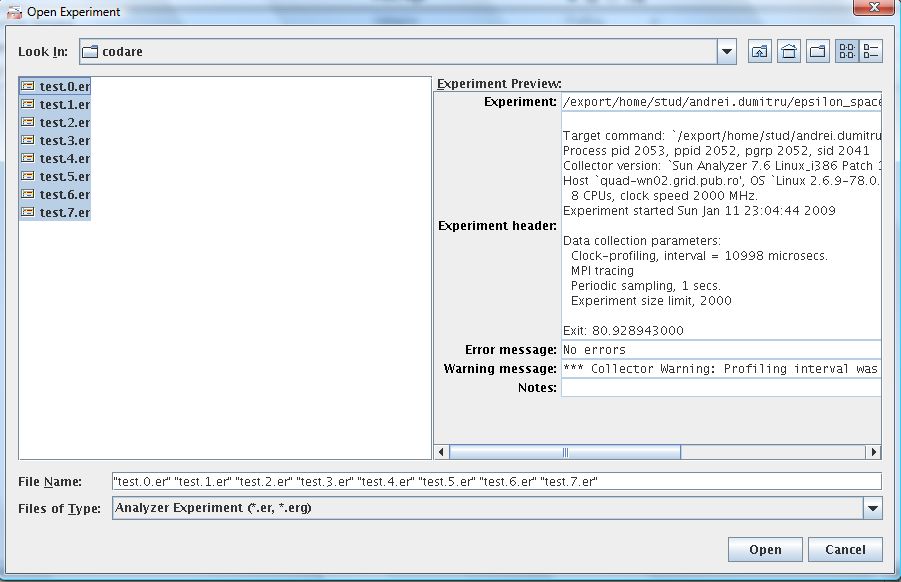
8. Enjoy...
