Eneco
- Details Hits: 11916

Introduction
Our team won the Suceava Hard & Soft International Contest 2011!
In this article I would like to briefly present the idea and the concept of the whole project as well as the Android interface which I built for this contest (this was my job).
Project Description
The project focuses on harvesting energy from the environment through as many ways as possible, and efficiently using the harvested energy in an off-grid building, adapting the consumption to the currently available energy levels. The main energy sources to be used for harvesting are:
- solar energy
- wind energy
- waste wireless communication energy
- hydro energy
Through its web and Android interfaces, the project offers functionalities such as analysing the harvesting efficiency, energy consumption throughout the building, setting up profiles and managing consumers individually. The system can switch AC sockets on or off and can turn light dimmers down or up in order to adjust consumption to the current energy levels in the system.
System Diagram
The system has a hierarchical architecture, with a System Server as a central node, which acts as a gateway between the user interfaces and the harvesters and consumers in the system. The System Server gathers data from the harvesters and from wireless smart energy meters that are installed on standard AC sockets and light dimmers. The system also publishes data to the user through the use of a web interface and mobile devices. The system is universal in a sense that any electrical consumer that needs to be plugged in a standard AC socket or can be connected through a light dimmer can be part of this system.
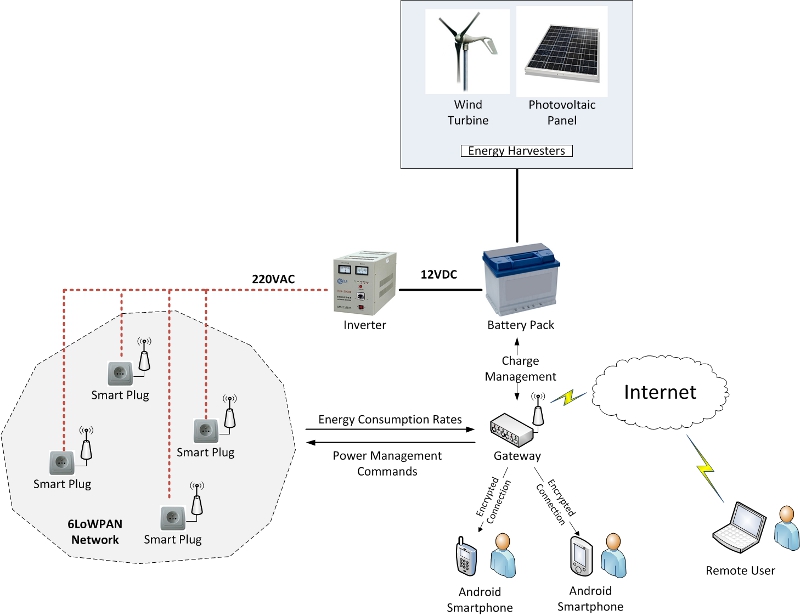
- System Server: this is the central part of our system. It is an embedded device, based on the OM11042 kit, built from scratch, which monitors the harvesters, communicates with the nodes on the consumers, stores data and publishes it on web interfaces and on smartphones.
- Harvesters: we have designed and built several alternative energy harvesters for the demo: solar energy, wind energy, hydro energy and wasted wireless energy. These are pumping energy in a 12V motorcycle battery, whose energy level is permanently monitored and is dirrectly available to the user. Of course, in practice, even greater alternative energy harvesters are available.
- Wireless Nodes: the nodes are connected to each plug and each light in the system. They have a double purpose, of reading consumption data, which is forwarded to the system server and of performing actions such as switching off a plug or dimming down the lights.
- Interface Devices: the system server connects with a Wireless router through Ethernet. Users can access data and perform actions by connecting with username and password to this router. Two methods are supported: a web interface accesible from any browser and an Android application.
Various types of communication and protocols are used: the server uses SPI to communicate with the SD card which holds the data, connects through wireless with the nodes and using Ethernet with a router, which sits on the edge of the system, to wait for both wired and wireless internet connections with user computers or mobile devices.
Android Interface
Mobile devices are increasingly popular in all segments of society, which makes them an ideal interface device for our system. With the ability to connect securely to remote access points and to display high resolution, rich color graphs, they are quite often preferred by industrial and business solution providers as well.
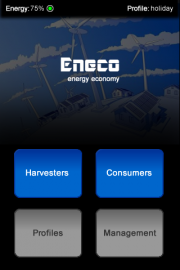

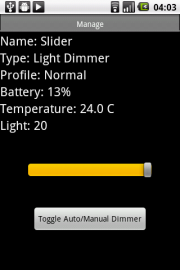
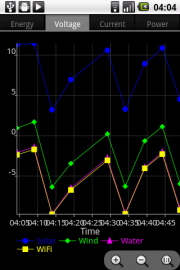
The Android interface in our project need to be able to both display rich information such as graphs and tables and to take in user action through forms.
User interface
The user interface maps the main scenarios and is divided into four main sections:
- Harvesters: allows the user to read information about the harvesters available in the system, with a comparison of their total efficiency. Each of the harvesters has also a detailed view, which gives additional information about their current voltage, current and power.
- Consumers: allows the user to read information about the consumers connected in the system. Each of the consumers has also a detailed view, which gives additional information about their current consumption and also allows the user to perform actions on individual plugs or dimmers, such as switching off or dimming down.
- Profiles: easily enables the users to specify a setting for all the consumers in the system.
- Management: enables the user individual access to each of the consumers, thus activating the custom profile.
Graphs
All charts are plotted using AChartEngine, a free software library for Android applications.
Graphs are available for both harvesters and consumers. Graphs can display individual devices or all of them:
- all harvesters: there is a separate graph for voltage, current, power and energy; the energy graph is a pie chart showing relative performance of the harvesters in the system;
- one harvester: if the user chooses only one harvester, its graph will show three separately colored lines corresponding to voltage, current and power;
- all consumers: there is a separate graph for voltage, current, power and energy; the energy graph is a pie chart showing which are the biggest consumers in the system;
- one consumer: if the user chooses only one consumer, its graph will show three separately colored lines corresponding to voltage, current and power.
Actuators
For each of the consumers, the user can set a state, depending on its type. For consumers that plug into sockets, the user can switch it on or off. For lights, the user can set a level. The Eneco system can also manage automatically all consumers according to the profile that the user set.
Communication
The mobile device connects to the router through wireless, using an username and password. The system server is connected to the router through Ethernet. After both connections were made succesfully, the two devices being in the same network, the data is acquired in a simple, previously agreed protocol: on a timebase of 5 seconds, the mobile device queries for data and stores it locally in order to compose the necessary graphs. In order to do this, a service is running in the background of the Android device, which polls the server on a timebase of 5 seconds, using the HTTP protocol.
Full Project Documentation
The full project documentation can be found here:
http://elf.cs.pub.ro/pm/wikihs2011/doku.php
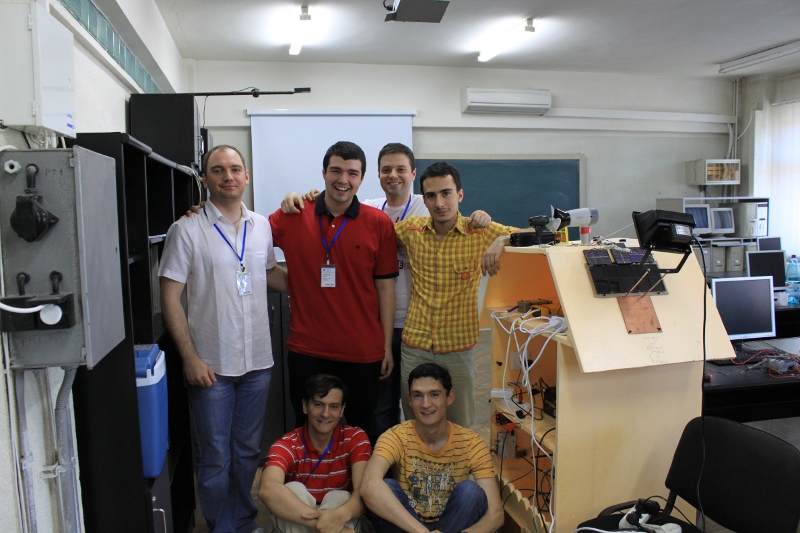
The Team
Politehnica University of Bucharest
Members: Vlad-Ştefan PETRE, Andrei-Alexandru SCUREI, Matei TENE, Adrian BOSTAN
Adviser: Nicoale ŢĂPUŞ, Coach: Dan-Ştefan TUDOSE, Alexandru OLTEANU
Author
Vlad Petre
vlad[at]vladpetre[dot]com
http://twitter.com/vladpetre88
http://linkedin.com/in/vladpetre88
http://slideshare.com/vladpetre88
